Thanks everyone for your feedback yesterday on the Development Application Average Assessment Days chart. Some of it was constructive, while some of it was less so, but regardless I’ve made some adjustments to further the discussion.
The first chart shows both the average assessment days (in green), the number of applications received (in grey), and a 5 month rolling average of the applications received (in purple). The main takeout is that in 2024 there was an overall decline of 27% in the volume of development applications compared to 2023, and I suspect that uncertainty with the State Government’s incremental trickle-down planning changes (that have yet to be finalised by the way!!) along with the time it takes to follow-up with preparing a development application could be a major driver for the decline in average assessment days. The staff therefore have a smaller queue to deal with and could therefore pump the backlog faster, although my understanding is that part of the improvement has also been due to other operational adjustments. We should see further improvement once we have the findings of the DA service review.
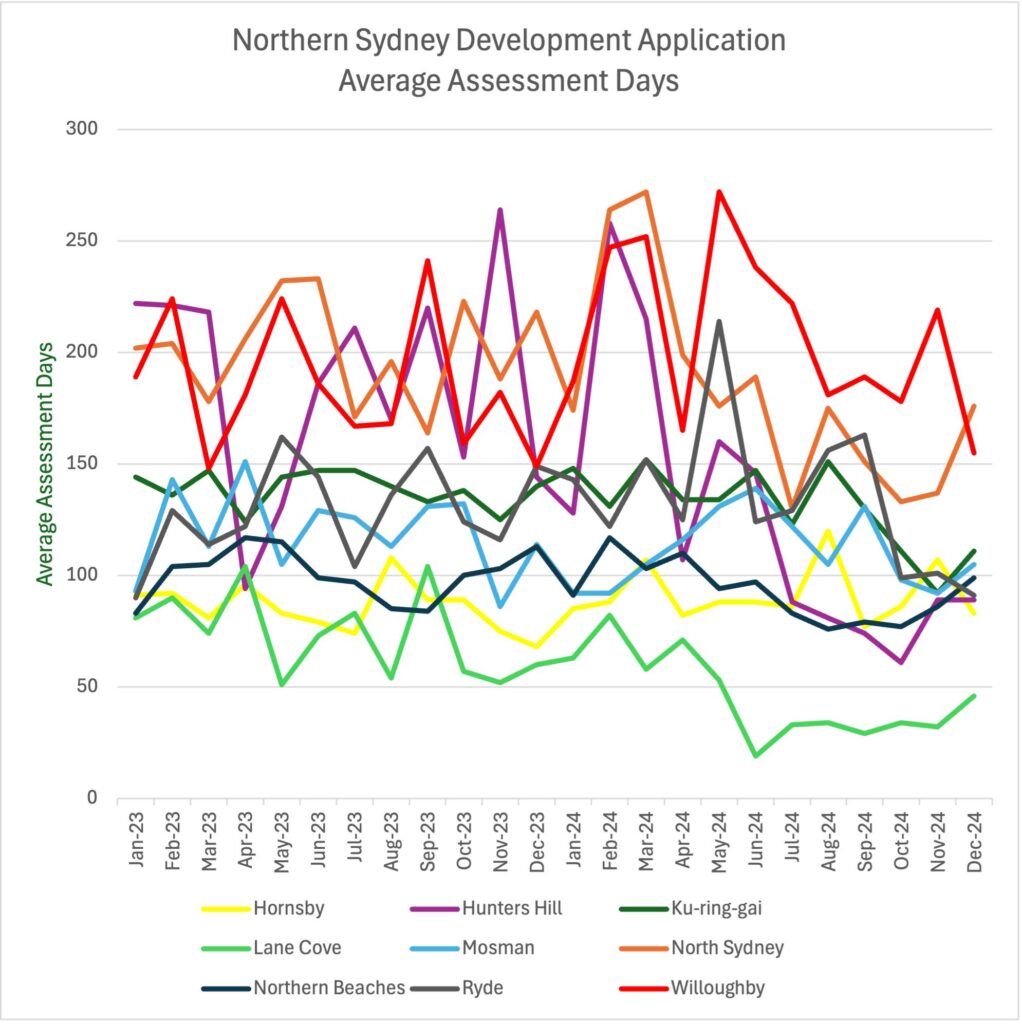
The second chart gives a comparison of average assessment days for each Northern Sydney Council. At a very high level it’s safe to say that: – Hornsby, Lane Cove and Northern Beaches appear to be fastest; – North Sydney and Willoughby appear to be slowest; – Everyone else appears to be in between although Hunters Hill in particular is experiencing sustained improvement.
I wouldn’t necessarily draw conclusions out of the chart (such as one council doing a better job than another) because there are multiple factors in play, but for operational staff it may be worth exploring why some councils appear to do better than others… Is it due to factors outside of control (such as more complex mix of DAs) or is it due to process optimisations yet to come into play?
If you want to suggest improvements feel free to email me at sngai@krg.nsw.gov.au and I will send you the spreadsheet so that you can see the underlying data and directly make the changes yourself.